In the blue corner
262
Democrats
members who served this Congress
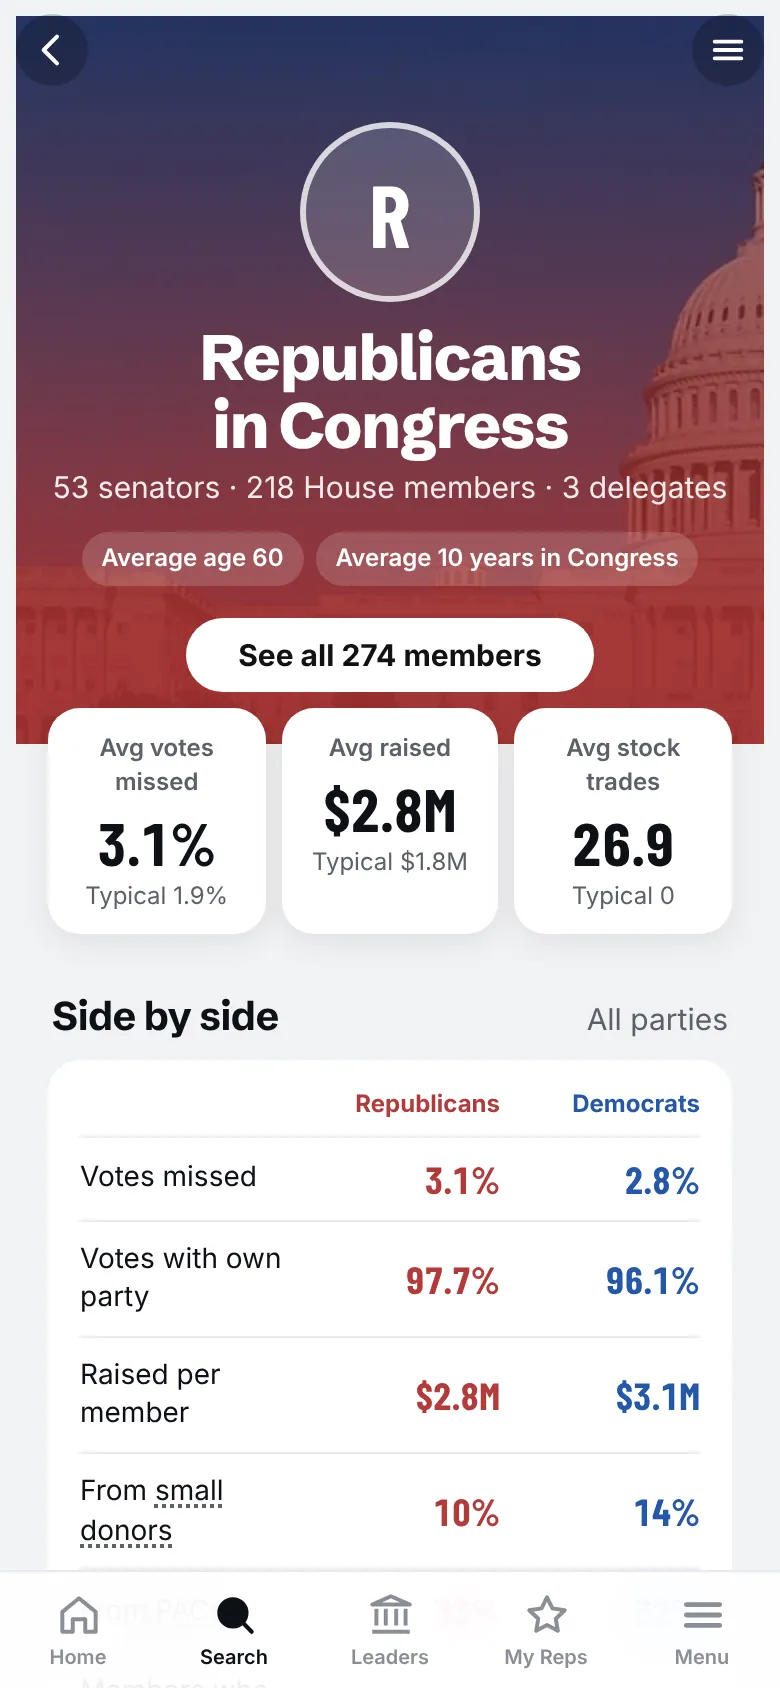
In the red corner
274
Republicans
members who served this Congress
Red vs Blue: the tale of the tape. Plus 3 independents. Same yardstick for everyone.
Round by round
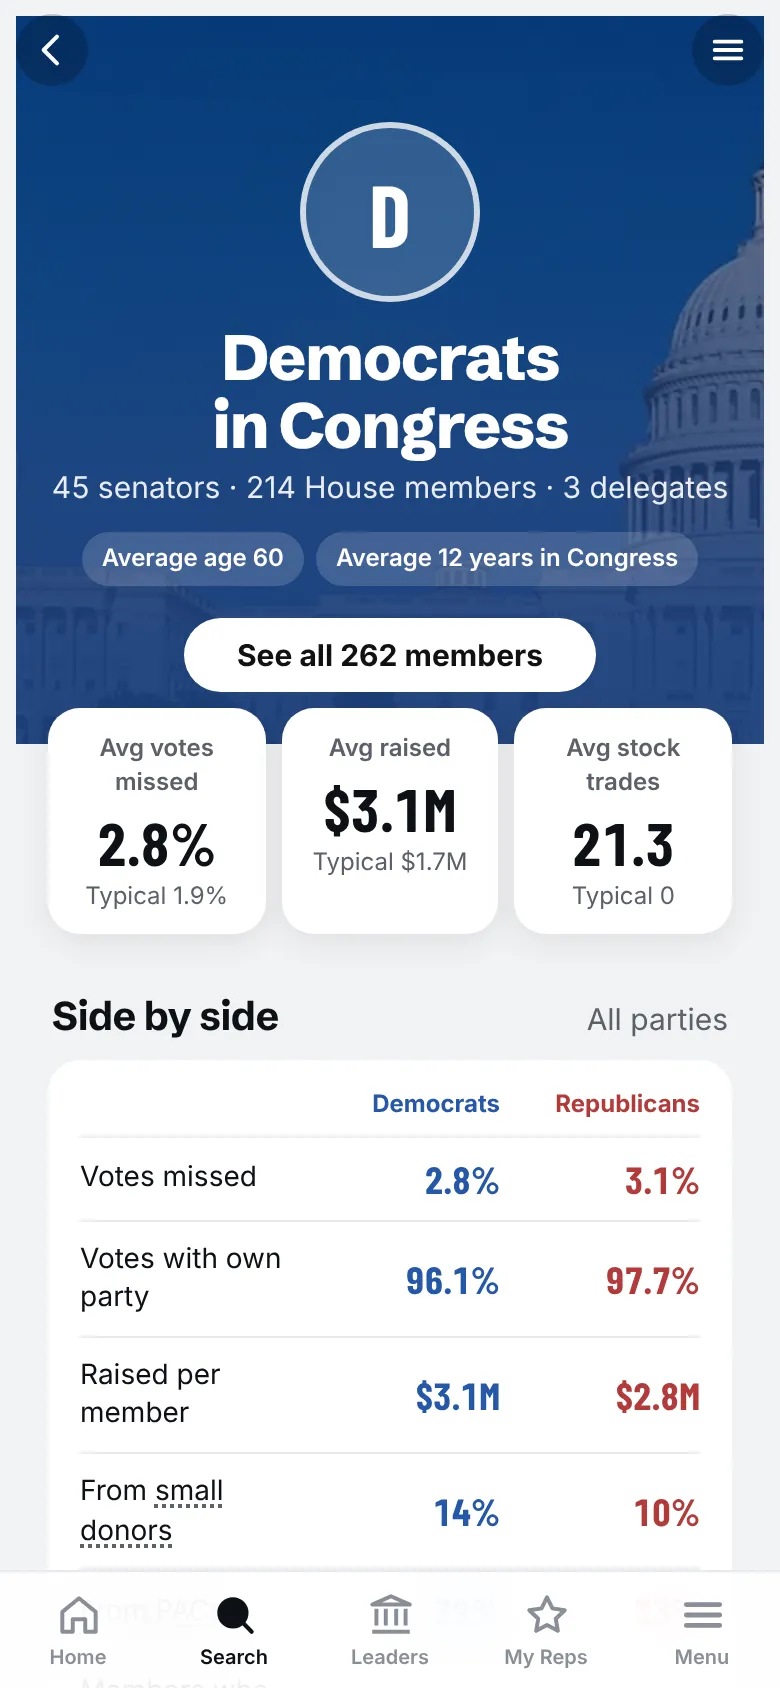
$3.1M
Average raised
$2.8M
14%
From small donors
10%
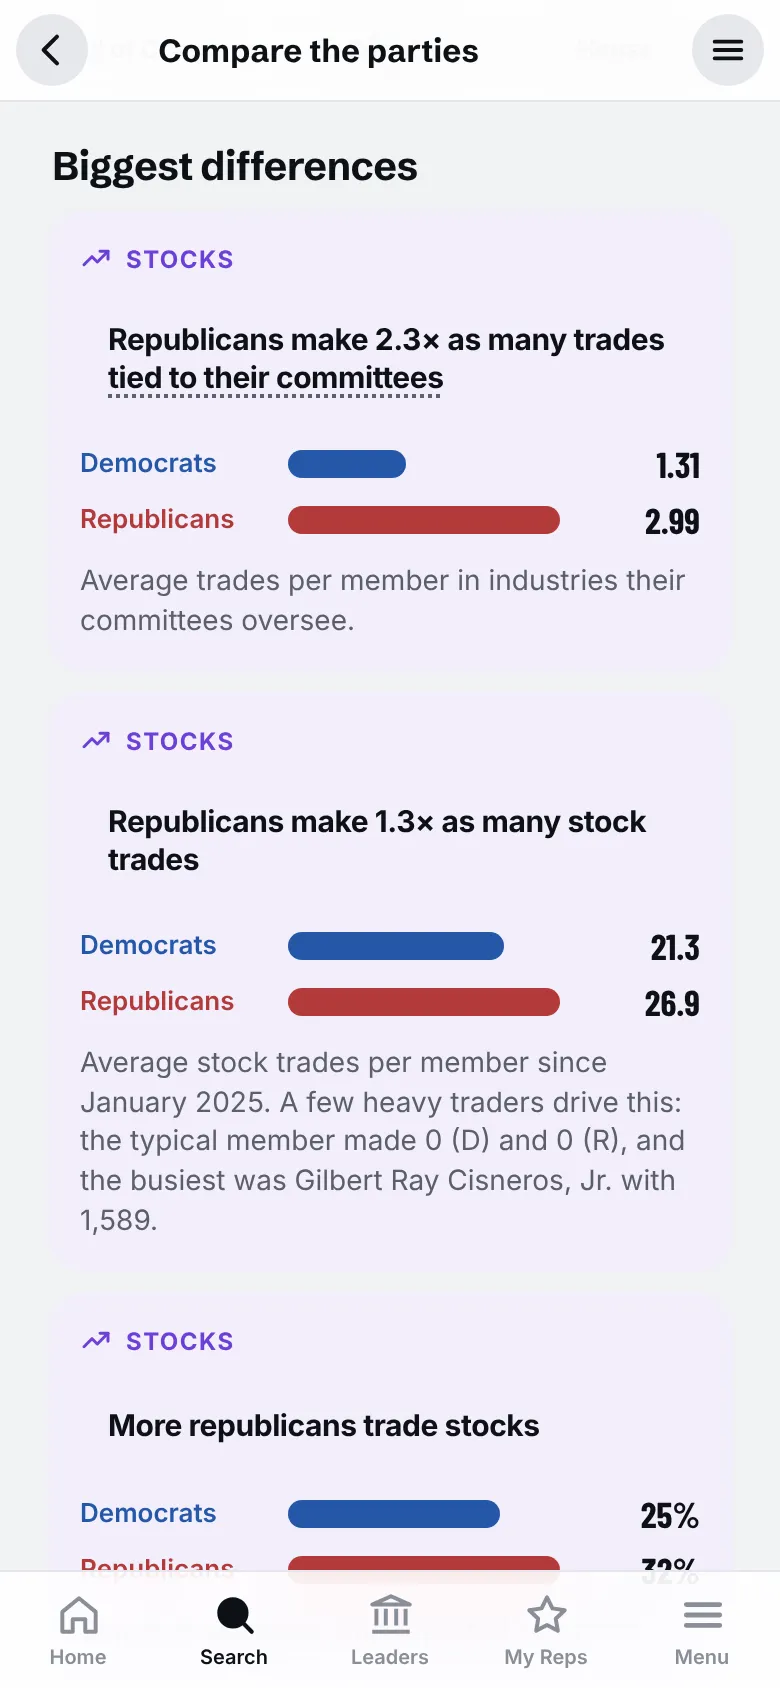
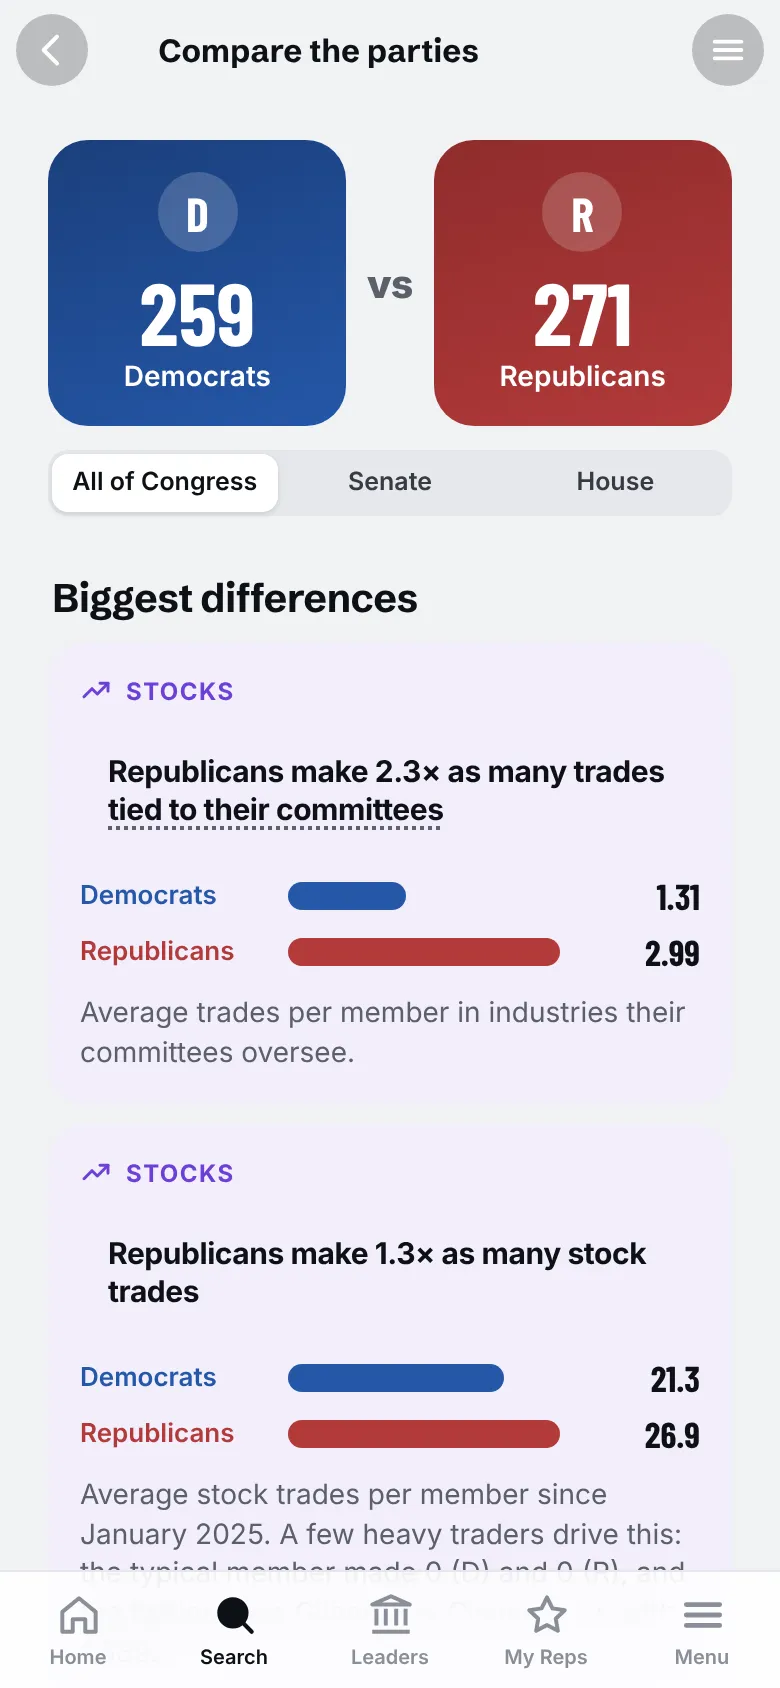
21.3
Stock trades per member
26.9
25%
Members who trade
32%
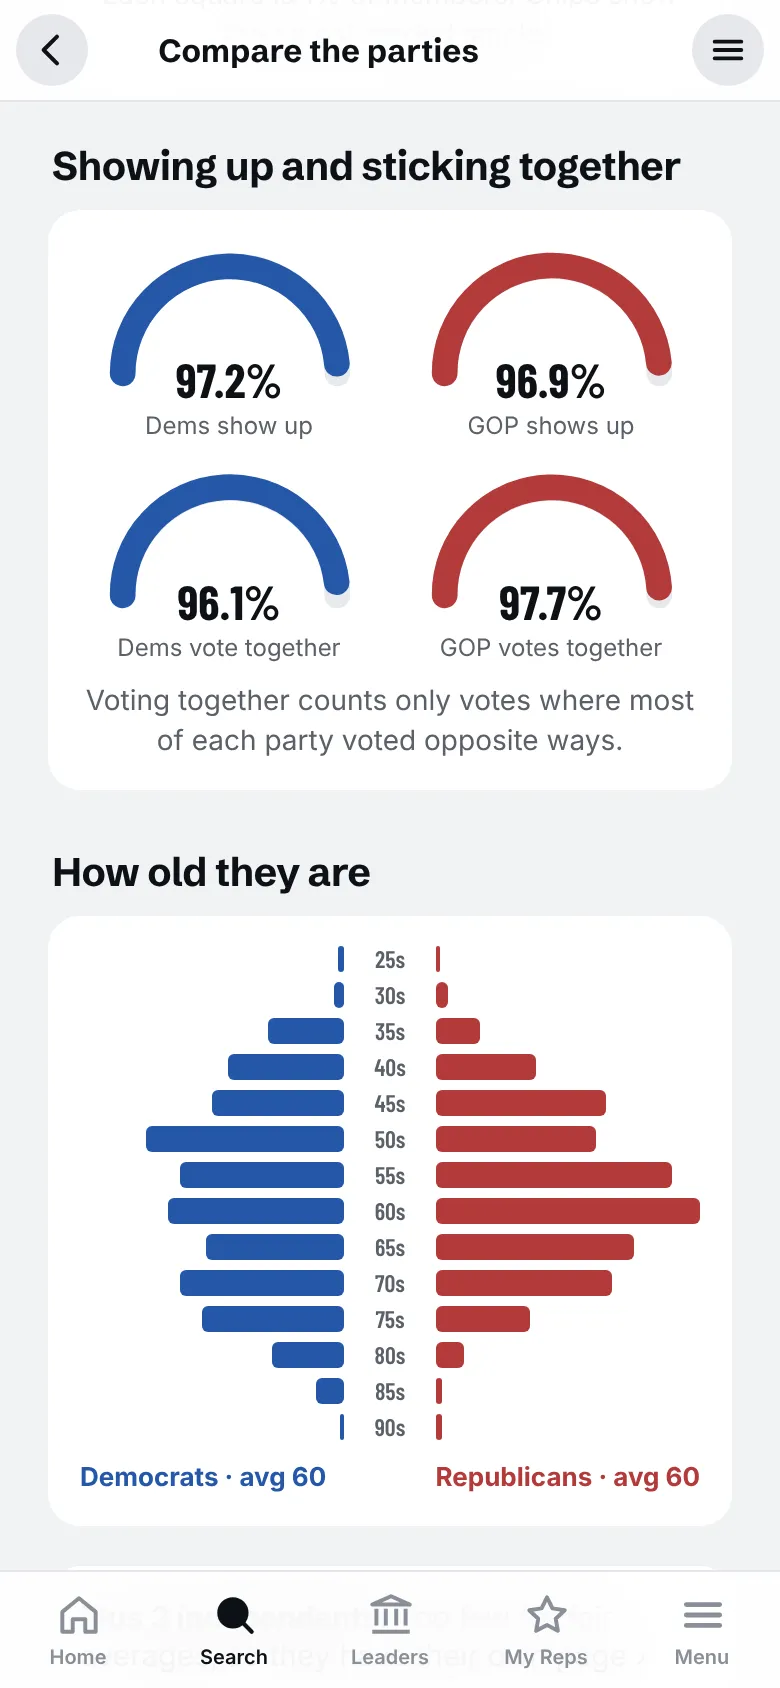
2.8%
Votes missed
3.1%
96.1%
Vote with their party
97.7%
60
Average age
60
Fun fact: the typical member of either party made zero stock trades. A few heavy traders pull the averages up.
The Senate is a different story
Same parties. Very different habits.
7.6×
more stock trades by Senate Republicans (36.5 vs 4.8 each), mostly one senator28%
of Senate Democrats' money from small donors, vs 11% for Republicans3.4×
more committee-tied trades by Senate Republicans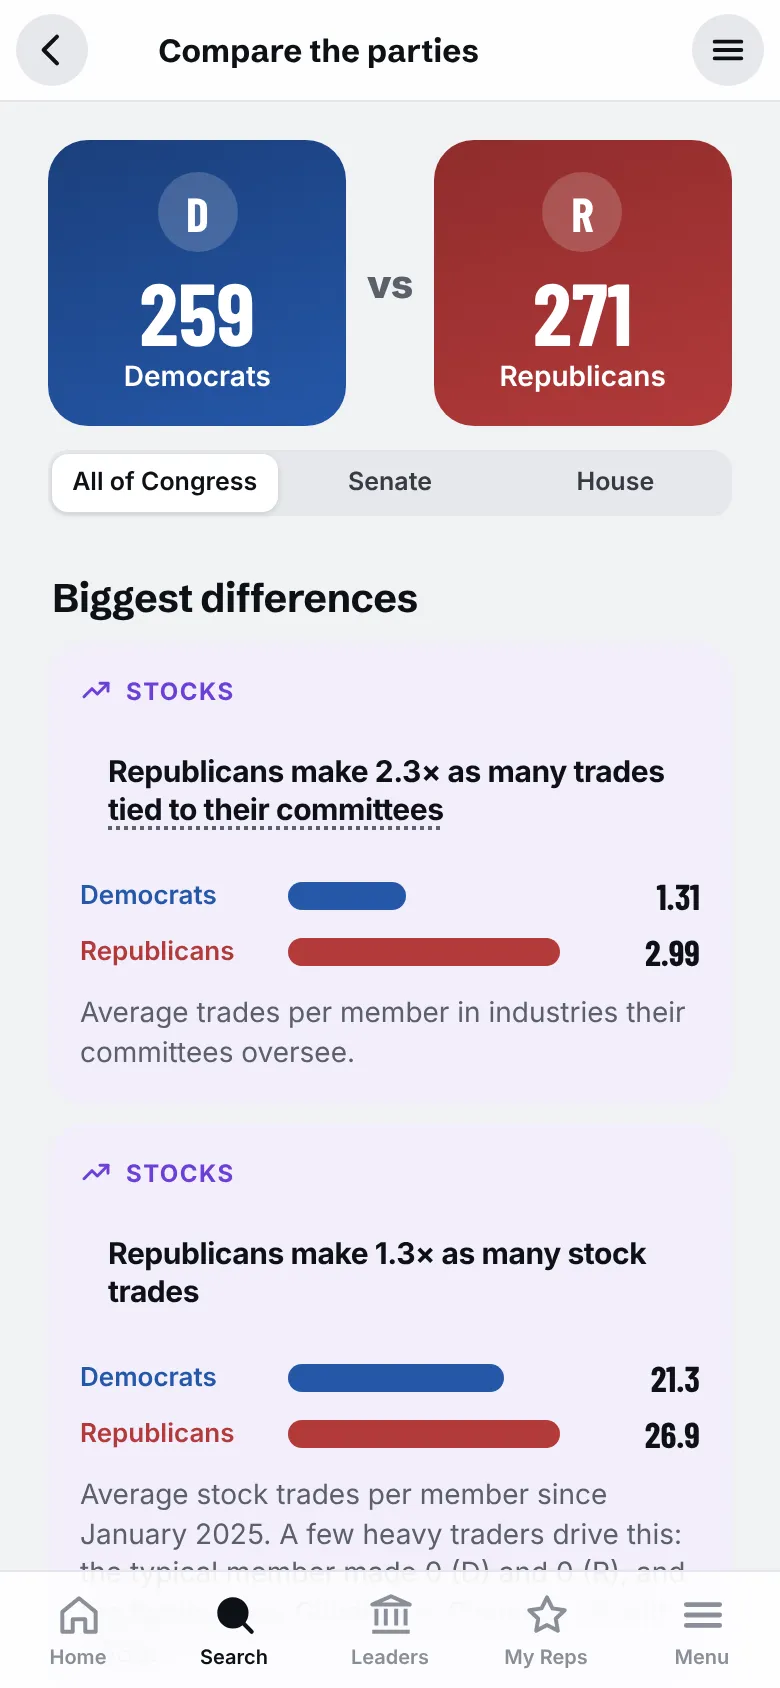
Compare anything. Side by side.
Pick House or Senate, then tap money, trades or votes. The app shows who wins each round instead of a wall of numbers.
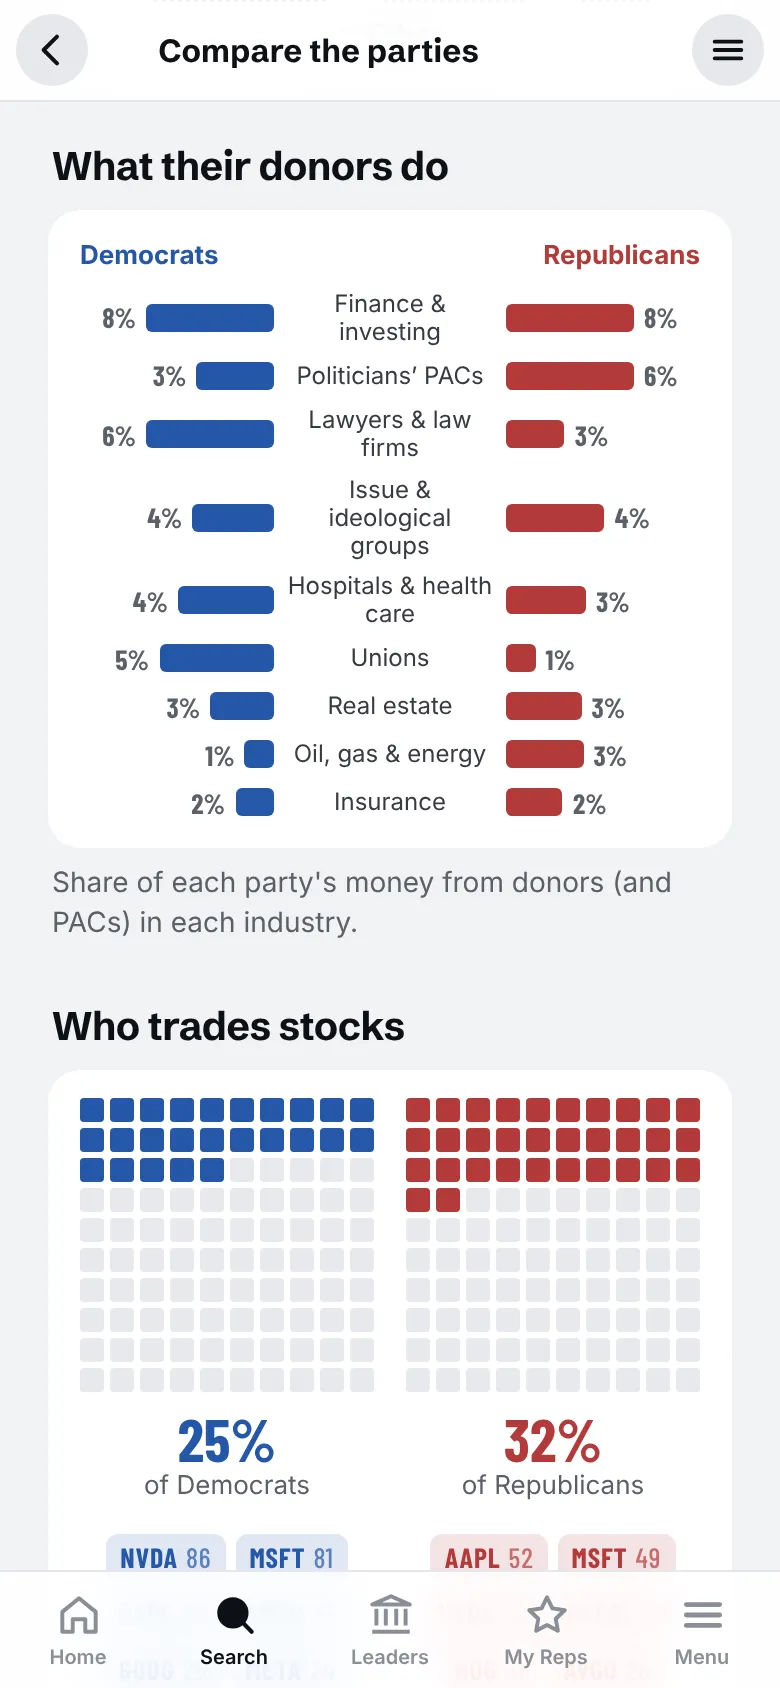
DEMOCRATS
A whole party on one page.
Averages, standouts, and who breaks from the pack.
REPUBLICANS
Same page. Same math.
No grades, no spin. Just the averages, measured the same way.